
Category / Uncategorized
How Much Does it Cost to Treat One Ebola Patient
The US State Department recently announced they will be bringing people from African countries who are infected with Ebola to the US for treatment. The expected cost per Ebola patient to be treated is $300,000. You can read the Washington Times article here but here is just a small caption:
The document has been shared with Congress, where lawmakers already are nervous about the administration’s handling of the Ebola outbreak. The memo even details the expected price per patient, with transportation costs at $200,000 and treatment at $300,000.
As with any government projected cost, this will probably go up. Each patient will be different and the costs will skyrocket if the patients turn worse like the patient in Dallas from Liberia.
Consumer Price Index Shows Inflation on Many Items

Consumer Price Index numbers were released Wednesday. Buried in the report were serious rises in year to date price increases. Here is list of price increases in the last 12 months:
Milk 8.7%
U.S. meat 13% (beef and veal prices up 18% and pork prices up 11.4%)
Butter 24%
Clothing 3.7%
Women’s Outerwear 11%
Children’s Footwear 7.8%
Prescription Drugs 3.8%
Lodging Away From Home 5%
Here is the complete article showing prices increases and decreases.
Oil Boom: Pic of Wages Posted at North Dakota Walmart

Indiana Gets “AA+” Grade From Fitch Ratings
Fitch Ratings assigns an ‘AAA’ implied GO rating to the state of Indiana and affirms the ‘AA+’ rating on outstanding Indiana appropriation-backed debt issued by the Indiana Finance Authority (IFA), the Indiana State Office Building Commission, and the Indiana Transportation Finance Authority.
The IFA was established in 2005. The state’s debt structure formerly was diffuse with state appropriation-backed debt issued through several commissions and authorities. The IFA is the successor agency to the former agencies.
The Rating Outlook is Stable.
Read the rest at HeraldOnline.com
NASDAQ & Producer/Consumer Price Index News
Here is some economic news I’ve picked up over several days pertaining to the stock market and prices on goods around the country.
About 47 percent of stocks in the Nasdaq Composite Index are down at least 20 percent from their peak in the last 12 months while more than 40 percent have fallen that much in the Russell 2000 Index and the Bloomberg IPO Index.
Here is a breakdown of Producer Prices
The Bureau of Labor Statistics reports that for the 12 months through August, producer prices increased 1.8 percent after rising 1.7 percent in July.
Prices for services related to securities brokerage and dealing fell 4.5 percent in August.
Gasoline index fell 1.4 percent.
Prices for utility natural gas, chicken eggs, diesel fuel, electric power, and raw cotton also moved lower.
The index for potatoes surged 28.0 percent.
Prices for pharmaceutical preparations and jet fuel also advanced.
Consumer Price Index showed decreases and increases as well. I highlighted the bigger jump in food prices jumping with inflation.
Over the last 12 months, the all items index increased 1.7 percent. The energy index fell 2.6 percent, with the gasoline index declining 4.1 percent and the indexes for natural gas
and fuel oil also decreasing.Food index rose 0.2 percent in August after increasing 0.4 percent in July. The food at home index was also up 0.2 percent. The index for meats, poultry, fish, and eggs rose 1.5 percent in August, the largest increase among the groups. The index for beef and veal rose 4.2 percent, its largest increase since November 2003. The index
for dairy and related products rose 0.6 percent, and the cereals and bakery products index advanced 0.2 percent.Over the last 12 months, the food at home index has risen 2.9 percent, with the index for meats, poultry, fish and eggs up 8.8 percent.
And finally, picked up an explanation on gas prices stabilizing or decreasing here lately.
The fall in the gasoline index can best be understood in terms of the increased oil productivity in the U.S. OPEC production continues to hover between 36mbd and 38mbd. BUT, non-OPEC output rose to a record 54.8mbd during July. Contributing to that record high is US oil field production, which is soaring and reached almost 9.0mbd in early September. The US is now exporting 3.7mbd of crude oil and petroleum products.
Hat Tip many sources
Saudi Arabia: Nuclear/Solar Power Expansion
Saudi Arabia has recently announced a very aggressive plan to start introducing nuclear power plants and big solar farms into their power supply grid to replace hyrdrocarbons. I find it insane the U.S. does not pursue nuclear energy in all forms. It would stabilize the entire country and be a source of power for decades to come. Here is the entire article but will pass along the highlights.
The Saudi Royal Family hopes that nuclear will provide 15% of the Kingdom’s power (18 GWe) within 20 years, together with a similar 15% (40 GWe) from solar. They are planning to invest $80 billion to build over a dozen nuclear power plants as fast as possible, intending for the first reactor to come online in only eight years. Investment in solar for the same energy production will take about $240 billion in investment, although breakthrough technologies in the next decade should cut that cost in half.
Total electricity consumption in Saudi Arabia exceeds 200 billion kWhs per year and is expected to double by 2030
Two largest uses of power in the Middle East are for desalinating seawater and residential cooling. Saudi Arabia desalinates over 250 billion gallons of seawater each year, and that number will double in the next ten years as the population and industrialization increase.
Saudi Arabia burns almost a billion barrels of oil a year to produce electricity
Saudi’s neighbor, Abu Dhabi in the United Arab Emirates started towards the solar/nuclear combination as well. Here is an interesting note to show how much solar it takes to equal nuclear power
Recently the UAE opened what was, at the time, the largest solar plant in the world, the 100 MW Shams 1 at a cost of about $600 million. But two hundred Shams 1 arrays will be needed to equal the output of the four Barakah nuclear reactors.
CDC Stats of Children Born to Unwed Mothers
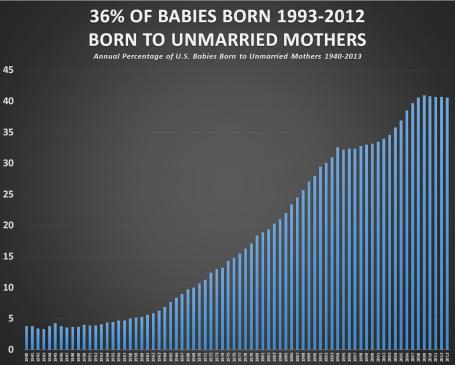
In 2013, 40.6 percent of babies (1,605,643 out of 3,957,577) born in 2013 who were also born to unmarried mothers. Since 2008 the births of babies to unwed mothers has topped 40% or higher. Compare this to the 1940 number of 3.8% with it only jumping to 5.3% 20 years later in 1960. Once the welfare programs of the “Great Society” were introduced in the mid 60’s the number of unwed mothers having babies jumped to 14.3% by 1975.
From 1983 to 2008 the percent of unwed mothers having babies went from 20 to 30 percent.
The reason babies born to unwed mothers is critical to watch with a nations economics is because historically this group gets government benefits in the form of welfare, WIC, housing, etc. Even the government has stated this in a recent report:
In its latest annual report to Congress on “Welfare Indicators and Risk Factors,” the Department of Health and Human Services pointed to the high rate of births to unmarried mothers, saying “data on nonmarital births are important since historically a high proportion of welfare recipients first became parents outside of marriage.”
“Historically a high percentage of AFDC/TANF recipients first became parents outside of marriage,” said this HHS report.
To back up the governments statement on this is earlier in the month it was reported that the US Government welfares roles had grown to 109 million citizens.
30% Drop in Soybean & Corn Prices?
Agricultural stocks have taken a beating just recently and one could speculate recent co mments/numbers0 could have this particular commodity market spooked.
The USDA just released numbers for Indiana and nationally on how yields will play out this fall for corn and soybeans. The plants them self are still in pollination stage, but each week gets us closer to the harvest. Here is what the USDA said via Hoosier Ag:
In Tuesday’s USDA report, corn production is forecast at 14.0 billion bushels. Yields are expected to average 167.4 bushels per acre, up 8.6 bushels from 2013. Soybean production is forecast at a record 3.82 billion bushels, up 16 percent from last year with yields expected to average a record high 45.4 bushels per acre. Indiana corn yields are forecast to be above the national average.
Indiana is forecast to set a new record high corn yield at 179 bpa with an estimated state production of 1.05 billion bushels, the second year in a row the Hoosier state has produced over a billion bushels of corn. Hoosier soybean yields are forecast to equal last year’s level at 51 bpa which will equal 279 million bushels of production. Winter wheat yield is estimated at 73 bushels per acre, even with last year’s record high. Winter wheat production is forecast at 26.3 million bushels.
With that data coming out, Purdue Ag Economist Chris Hurt says profit margins will be squeezed this year at the annual crop report analysis program at the State Fair.
“The revenues will be down sharply this year; crop farmers’ incomes could fall 25-30 percent.” Hurt predicts that corn and soybean prices will continue to move lower as we approach harvest, “This report will not give us new lows; but, if the September and October reports show an increase in corn yields, we could see new low prices.” Hurt said if the National average yield tops 170 bpa, corn prices could dip as low as $3.20 a bushel.
Shuan Casteel, Purdue soybean specialist and Extension agronomist Dr. Bob Nielsen were also in attendence at the State Fair panel. They stated crops were ahead five year averages and that the crops still have 30-45 days of yield potential despite the cool weather.
The Nine Pound Gold Shirt
Sometimes in life it’s o.k. to splurge on clothes shopping. But one man did it in a big way and Economic Policy Journal lays out the details:
Pankaj Parakh owns a pure gold shirt worth about £127,000 (roughly $213,000).He had it custom-made for his 45th birthday. The shirt, made out of 18-22 carat gold, weighs more than four kilograms (nearly nine pounds). The gold itself is 18-22 carat purity, and there have been no other metals used. It is lined with a thin cloth for added comfort

