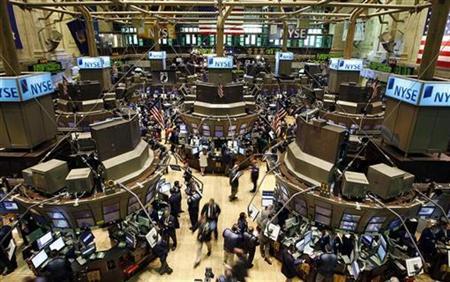
Today, the Dow Jones is over 21,000 points. 30 years ago it was much lower….way lower. Continue reading →
Today, the Dow Jones is over 21,000 points. 30 years ago it was much lower….way lower. Continue reading →
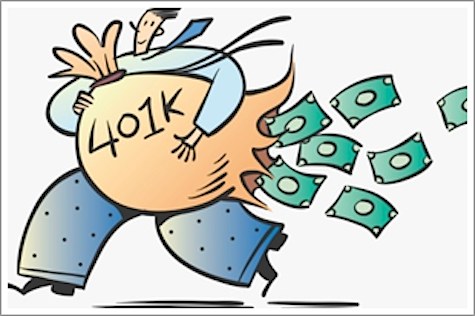
Photo via http://www.thedigeratilife.com
EconomicPolicyJournal.com posted a write up(full article here) about 401k’s being a scam. Economics needs
Via USA Today –
One month after unveiling its new streaming music service, Apple has locked in 11 million trial members, company executives tell USA TODAY.
“We’re thrilled with the numbers so far,” says Eddy Cue, Apple’s senior vice president of Internet software and services, adding that of that sum 2 million have opted for the more lucrative family plan at $14.99 a month for up to six people.
Apple Music, which launched June 30, costs $9.99 a month for individual access to 30 million songs as well as human-curation playlists and a live radio station. There is an initial free-trial period of three months. Assuming all the trial memberships are converted into paying customers come October, Apple would already boast half the paid memberships of reigning streaming champ Spotify, which launched nearly a decade ago.
Angie’s List Inc.recently announced they put their Indianapolis project on hold due to the new RFRA law signed by Indiana Governor Mike Pence. This company has been bleeding money for quite some time and just went to the state begging for $18.5 million in public assistance. Here is snapshot I took this morning of how bad the stock has dropped in one year:

Overall Angie’s List announcement on this matter is more desperation than practical. Crony capitalist companies like Angie’s List use tactics like this to hedge their bets in order to get more money out lawmakers then standing up for some social issue.
Here is some economic news I’ve picked up over several days pertaining to the stock market and prices on goods around the country.
About 47 percent of stocks in the Nasdaq Composite Index are down at least 20 percent from their peak in the last 12 months while more than 40 percent have fallen that much in the Russell 2000 Index and the Bloomberg IPO Index.
Here is a breakdown of Producer Prices
The Bureau of Labor Statistics reports that for the 12 months through August, producer prices increased 1.8 percent after rising 1.7 percent in July.
Prices for services related to securities brokerage and dealing fell 4.5 percent in August.
Gasoline index fell 1.4 percent.
Prices for utility natural gas, chicken eggs, diesel fuel, electric power, and raw cotton also moved lower.
The index for potatoes surged 28.0 percent.
Prices for pharmaceutical preparations and jet fuel also advanced.
Consumer Price Index showed decreases and increases as well. I highlighted the bigger jump in food prices jumping with inflation.
Over the last 12 months, the all items index increased 1.7 percent. The energy index fell 2.6 percent, with the gasoline index declining 4.1 percent and the indexes for natural gas
and fuel oil also decreasing.Food index rose 0.2 percent in August after increasing 0.4 percent in July. The food at home index was also up 0.2 percent. The index for meats, poultry, fish, and eggs rose 1.5 percent in August, the largest increase among the groups. The index for beef and veal rose 4.2 percent, its largest increase since November 2003. The index
for dairy and related products rose 0.6 percent, and the cereals and bakery products index advanced 0.2 percent.Over the last 12 months, the food at home index has risen 2.9 percent, with the index for meats, poultry, fish and eggs up 8.8 percent.
And finally, picked up an explanation on gas prices stabilizing or decreasing here lately.
The fall in the gasoline index can best be understood in terms of the increased oil productivity in the U.S. OPEC production continues to hover between 36mbd and 38mbd. BUT, non-OPEC output rose to a record 54.8mbd during July. Contributing to that record high is US oil field production, which is soaring and reached almost 9.0mbd in early September. The US is now exporting 3.7mbd of crude oil and petroleum products.
Hat Tip many sources

John Maxfield from theThe Motley Fool penned an article in the USA Today that shows an enticing graph of potentially the next big crash in the markets.
Austrians economic disciples have been screaming the last decade about the Federal Reserve’s printing or now digitizing of money to the banks through borrowing. On top of that, the federal government has needed massive amounts of money to fund welfare/social programs that are by law “mandatory”.
Maxfield and Austrians part ways with his explanation in the article. There really is no more denying inflation is happening. Pricing is exploding across many sectors.
Personally, I have followed the Feds printing and done well. But the money supply is drying up and a downturn is very real down the road
Here some quick hits of economic news that people who follow economics
and investors should like:
Margin debt: The most recent numbers show a decline, which is bearish.
Gold is starting to get noticed again by investors.
The latest data shows that money managers increased net-long positions for a fourth straight week through July 1 and holdings in exchange-traded products are climbing at the fastest pace since 2012. Holdings are rebounding after six straight quarterly declines that began before gold entered a bear market in April 2013.
Several months back due growing money supply from the Federal Reserve creating an artificial boom in stocks I plunged a lot of cash into oil and agriculture. I have not been disappointed. For example, The Bloomberg Commodity Index, for example, rose 7.1 per cent in the first half of the year.
