If you have cable, tv networks like ESPN, TNT and TBS gets paid by you even if you don’t watch them.

If you have cable, tv networks like ESPN, TNT and TBS gets paid by you even if you don’t watch them.

In a new lengthy write up on disturbing side effects of ADHD drugs

Production of the once in demand CD has dropped 88% since 2001. Continue reading →
I stumbled upon some historical economic data in regards to prices paid for groceries in the 1990’s. Continue reading →

Florida produces a lot of oranges and demand for them is off the charts.

Have a an ex-boyfiend’s name tattooed on your back that you regret? Your once favorite time of your life on your chest that doesn’t quite make sense anymore? Continue reading →

Tariffs are bad in regards to real “free trade”, but the U.S. hardly imports much steel from China.

As billions of Catholics worldwide practice lent, giving up meat has shifted demand towards seafood.

The popularity of U.S. beer breweries is immense.

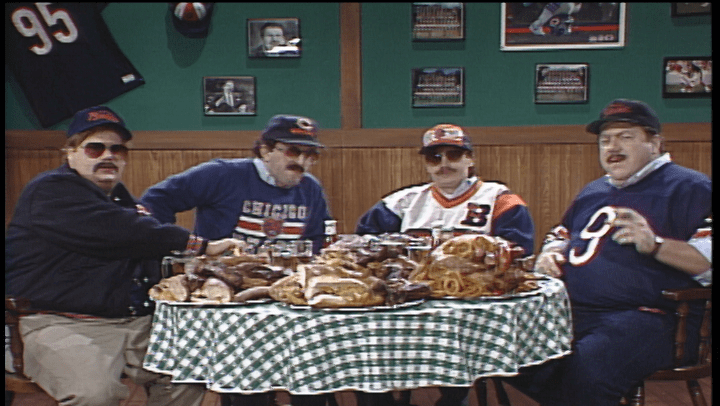
New reports are showing consumers are enjoying more protein in their diets. Continue reading →
