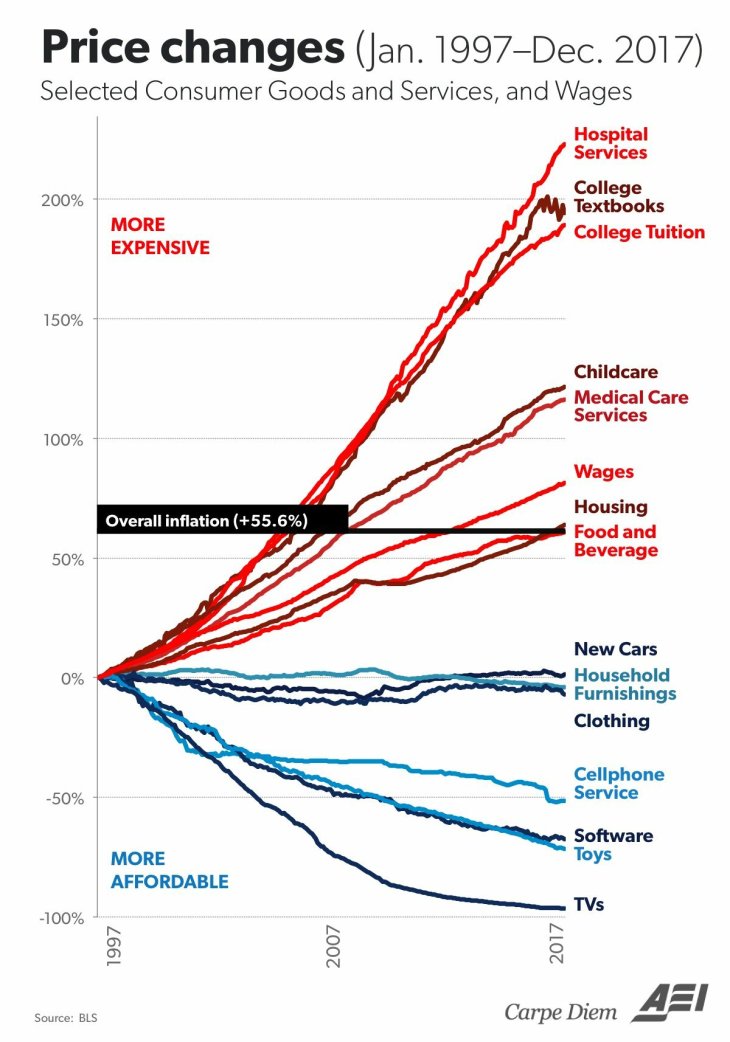
February 1, 2018February 1, 2018 by Hoosier Econ GRAPH: Consumer Price Changes From 1997-2017 Business, Dollar, Economics, Education, Financial, Indiana, Indianapolis, Money, United States Government clothing, college loans, consumer prices, electronics, hospital services, Inflation, tv's, Wages Leave a comment Economist Mark Perry has updated his famous inflation/deflation prices graph. Rate this:Share this: Email a link to a friend (Opens in new window) Email Print (Opens in new window) Print Share on Facebook (Opens in new window) Facebook Share on Reddit (Opens in new window) Reddit Share on X (Opens in new window) X Share on Tumblr (Opens in new window) Tumblr Share on Pinterest (Opens in new window) Pinterest Like Loading... Related